We began with a dataset drawn from the records of the Emigrant Industrial Savings Bank, held by the New York Public Library and digitized by Ancestry.com. This consisted of 64 people whose country of origin was Ireland, and who had an address in Brooklyn’s Fifth Ward, bordered by Bridge Street to the west, Johnson Street to the south, the East River to the north, and Navy Street and the U.S. Navy Yard to the east.
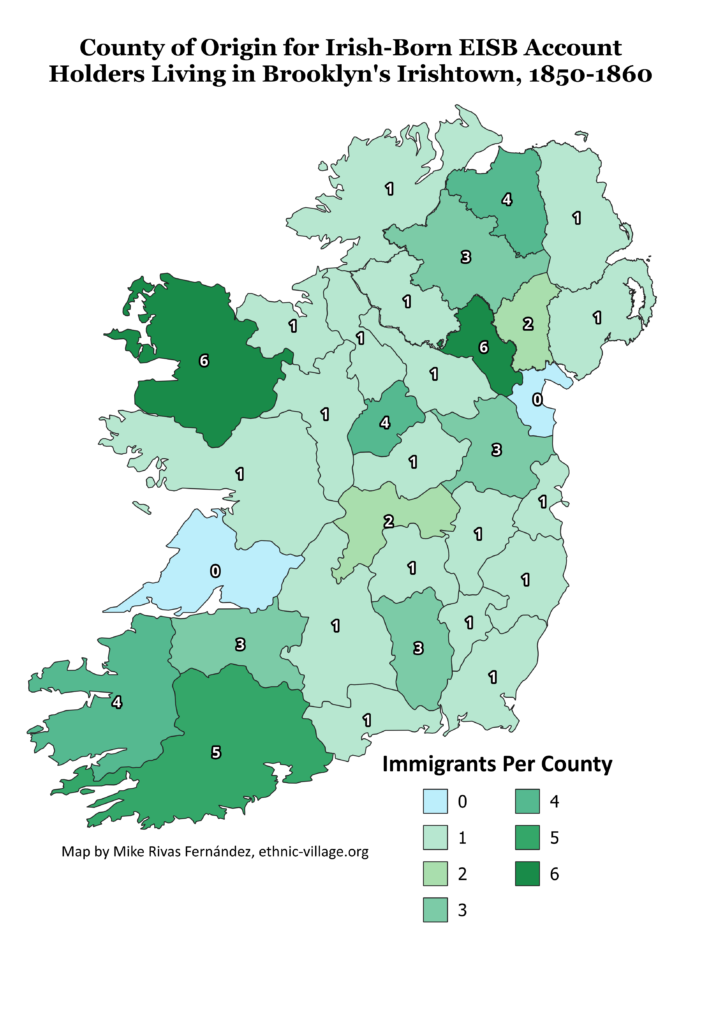
Emigration from Ireland to Brooklyn of Irishtown Residents and EISB account holders encompassed nativity from thirty of the thirty-two Irish counties, with all but Clare and Louth being represented. Mayo and Monaghan were the most common places of origin followed by Cork, Derry, Kerry, and Longford. Certain factors in individual counties influenced residents to emigrate. These included percentages of laborers (densely populated in parts of Cork, King’s, and Tipperary), levels of destitution, and the prevalence of evictions (a particular problem in Cavan). Source: Database created Fall 2024 at New York University from the records of Emigrant Industrial Savings Bank, 1850-1860. Chart created by Mike Rivas Fernández, based on 64 accounts.
This interactive map shows the approximate location for the town or village in Ireland that each immigrant listed as their place of origin in EISB account records. Made using Google MyMaps, created Fall 2024 at New York University.
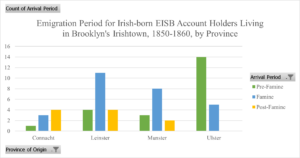
This chart shows the breakdown of emigration period by province of origin. Ulster is the only province where the majority of immigrants arrived in New York Pre-Famine (before 1845), with a majority of immigrants from both Leinster and Munster arriving during the Famine (1845-1851). Sample drawn from 59 accounts which had both province of origin and year of arrival available. Chart by Mike Rivas Fernandez.
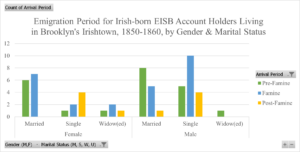
This chart shows the breakdown of emigration period by both gender and marital status. This reveals that all women arriving post-famine were either single or widowed, most married individuals arrived pre-famine, and a lot more single men than women arrived during the famine. Sample drawn from 58 accounts that had both year of arrival and marital status listed. Chart by Mike Rivas Fernandez
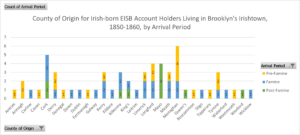
This chart shows the arrival period of immigrants broken down by their county of origin. All immigrants from County Mayo arrived post-famine, whereas for the rest of the counties which had multiple immigrants, the majority either arrived before or during the famine. Sample drawn from 59 accounts which listed both year of arrival and county of origin. Chart by Mike Rivas Fernández.
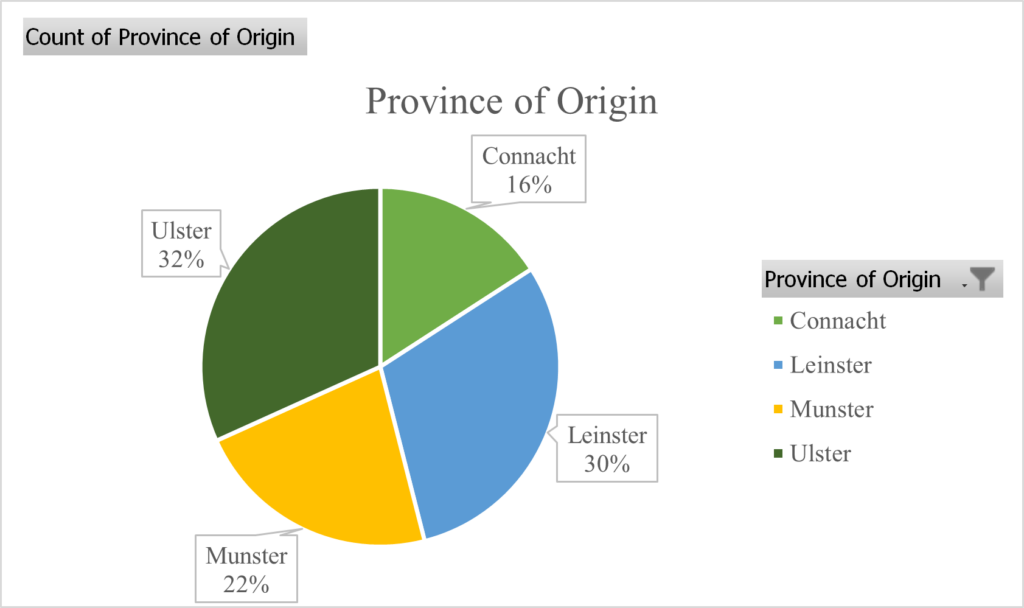
This chart shows the province of origin for our sample, with nearly two-thirds (62%) (39) being from either Leinster or Ulster, and only 16% (10) being from Connacht. Drawn from 63 accounts which had this data available. Chart by Mike Rivas Fernández.
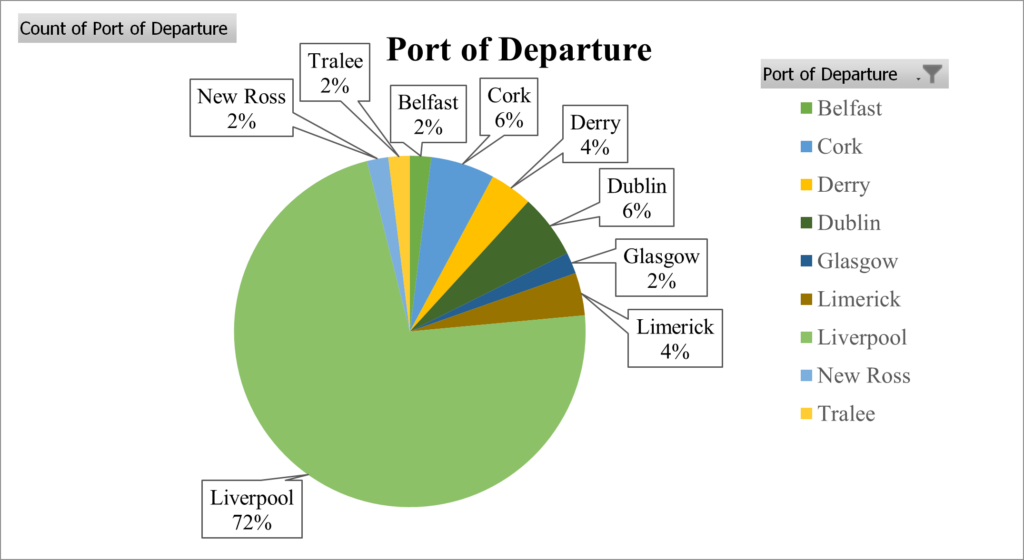
This chart shows the breakdown of ports from which Irishtown immigrants departed Europe. The vast majority departed from Liverpool (37). Drawn from 51 accounts which had Port of Departure listed. Chart by Mike Rivas Fernández
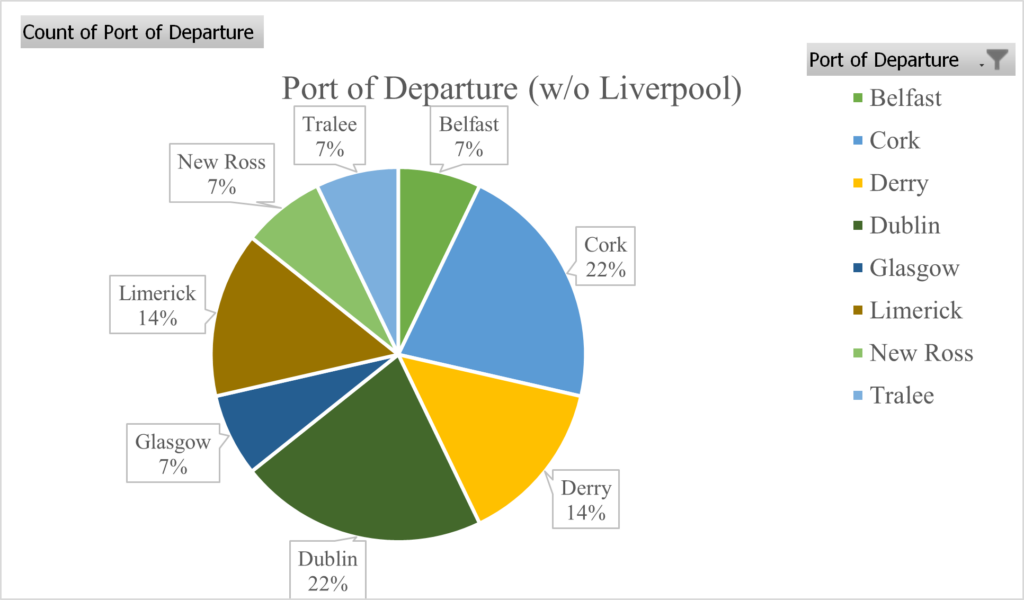
This chart contains the same data, with immigrants departing from Liverpool filtered out, which makes the breakdown for the other ports more visible. Drawn from 14 accounts which listed Port of Departure and did not list Liverpool. With the exception of one immigrant who departed from Glasgow, all these immigrants departed from Irish ports, with most (10/14) departing either before or during the famine. Chart by Mike Rivas Fernández
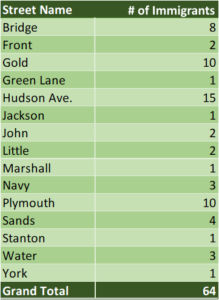
This table shows the names of the streets the immigrants in our samples listed on the EISB test books, which we used to draw our initial sample. The large majority of the sample lived in Gold St, Plymouth St, or Hudson Ave, out of a total of 64 accounts. Table by Mike Rivas Fernández.
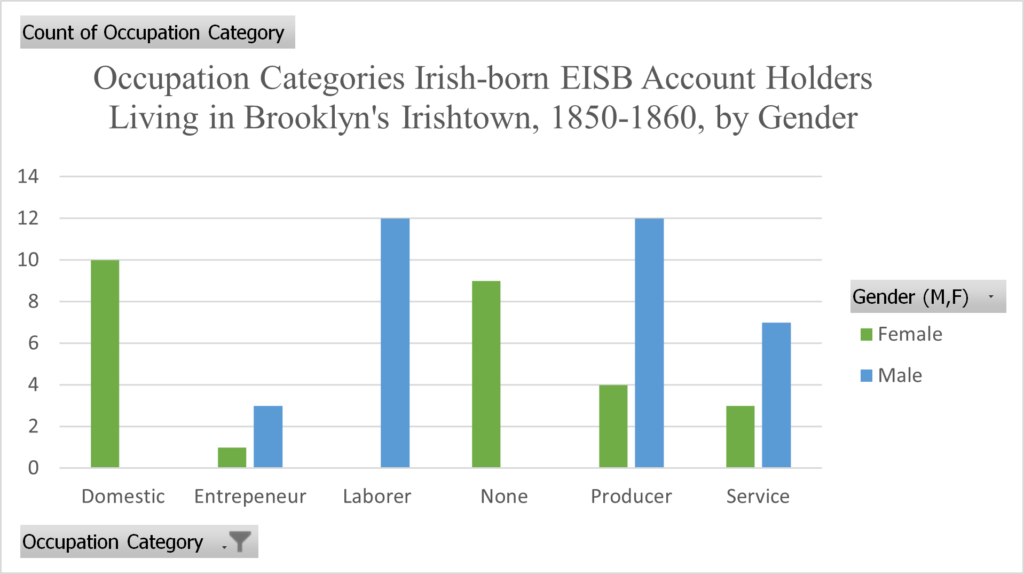
This chart shows the breakdown of Occupation Categories by gender. Entrepeneur includes those who owned and ran their own business (e.g., liquor dealer, grocer), Laborer includes both skilled and unskilled labor, Producer encompasses those who made a product for sale (e.g., crafts, artisans,printers, the needle trades, etc.), and Service encompasses individuals whose labor was available for hire/sale (e.g., a watchman, foreman, store clerk). Chart by Mike Rivas Fernández
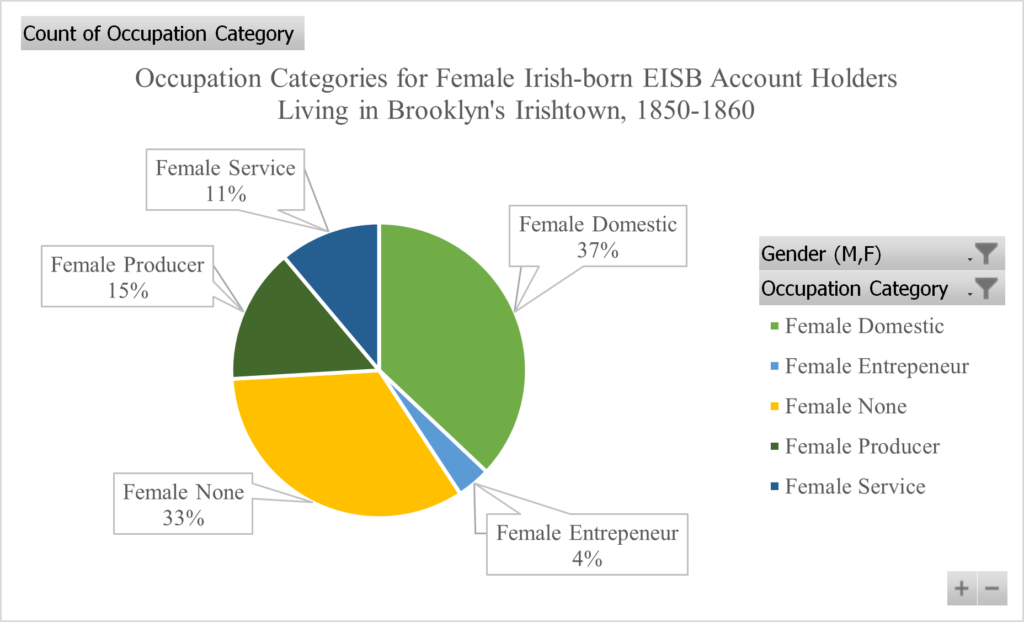
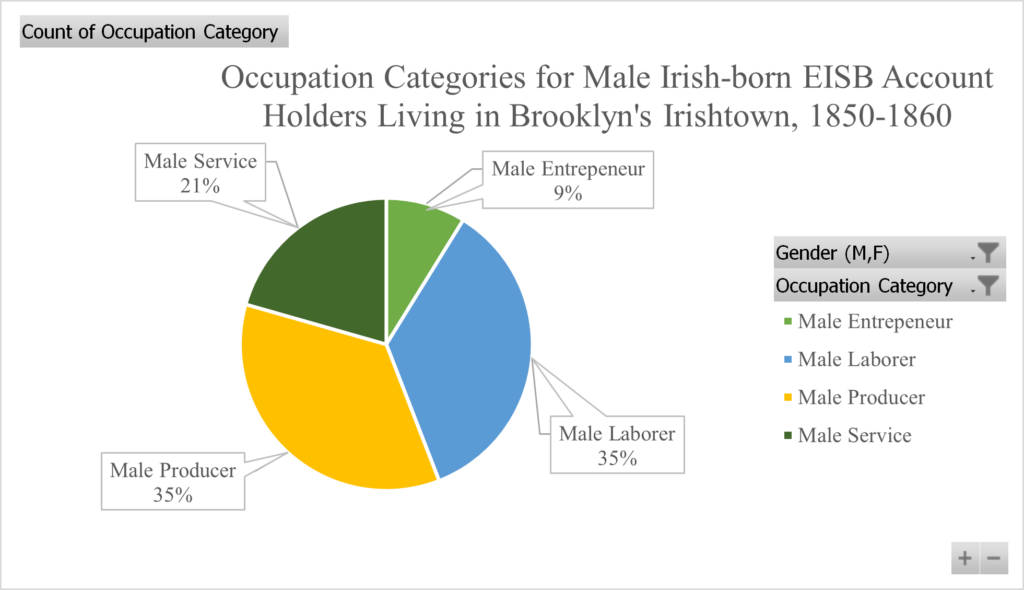
This chart shows the breakdown of occupation categories among females, out of a sample of 27 accounts with this data available. Chart by Mike Rivas FernándezThis chart shows the breakdown of occupation categories among males, out of a sample of 34 accounts with this data available. Chart by Mike Rivas Fernández
Using the Deposit Ledgers from the EISB records, we analyzed the average savings the immigrants in our sample held in their accounts. For all following charts, the savings amounts used are closing balances in 1860 dollars, and the sample is drawn from 59 accounts which had balances available.
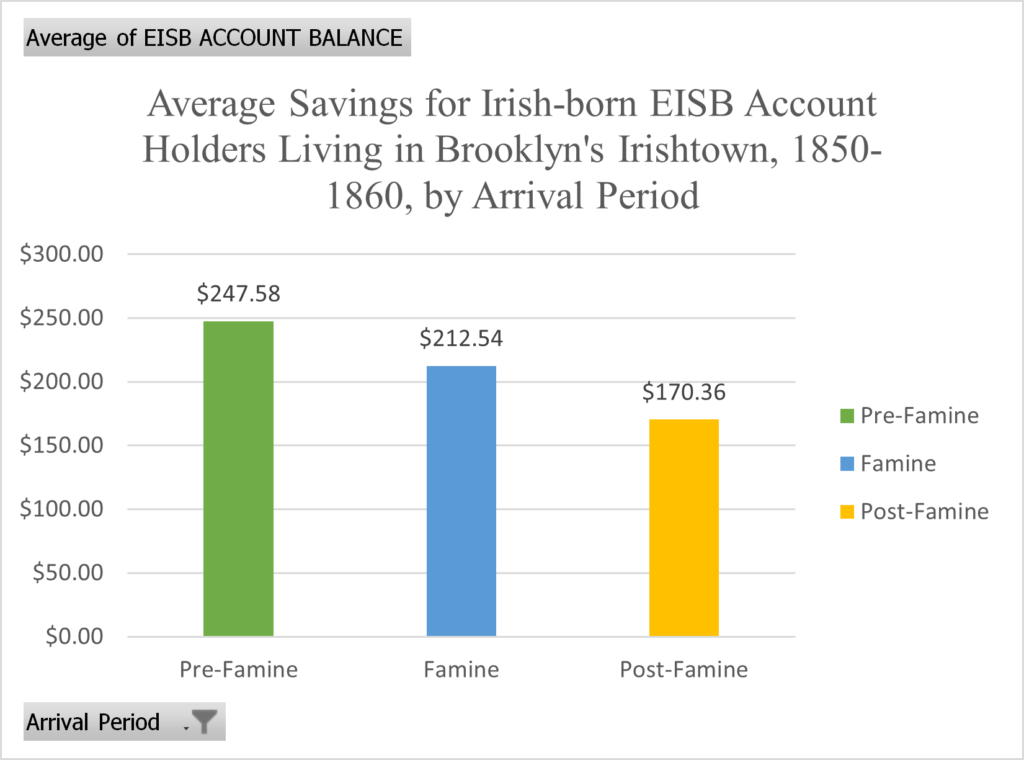
This chart shows the average savings balances in our sample broken down by the arrival period. These reflect the general trend that individuals who had been in Irishtown or New York for a longer time had built up higher savings. Chart by Mike Rivas Fernández
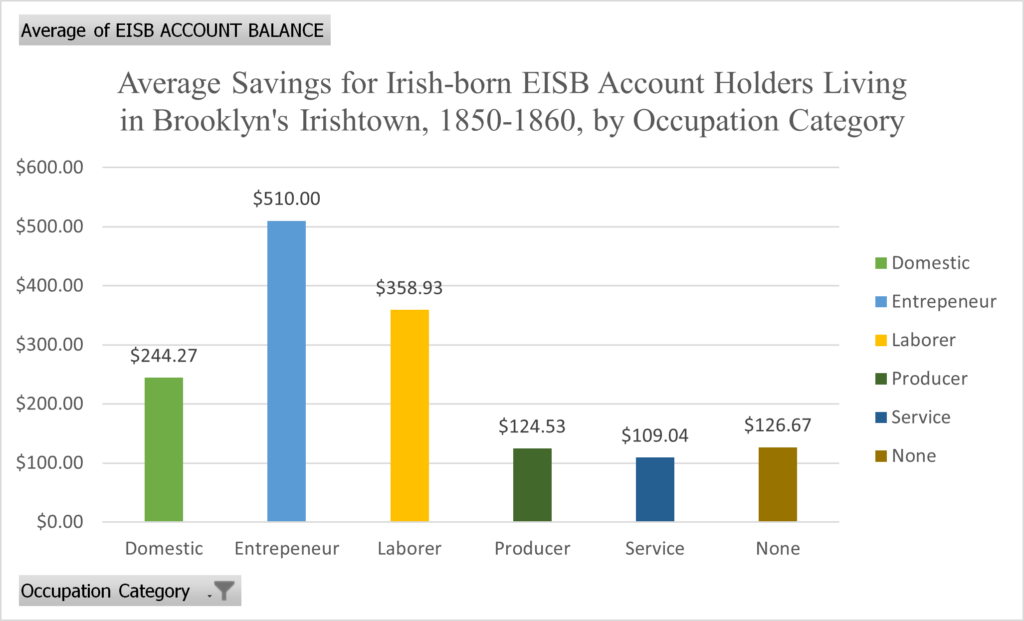
This chart shows the average savings balances for Irishtown residents broken down by occupation category, showing that Entrepreneurs had the highest savings, followed by laborers and domestic workers. Chart by Mike Rivas Fernández
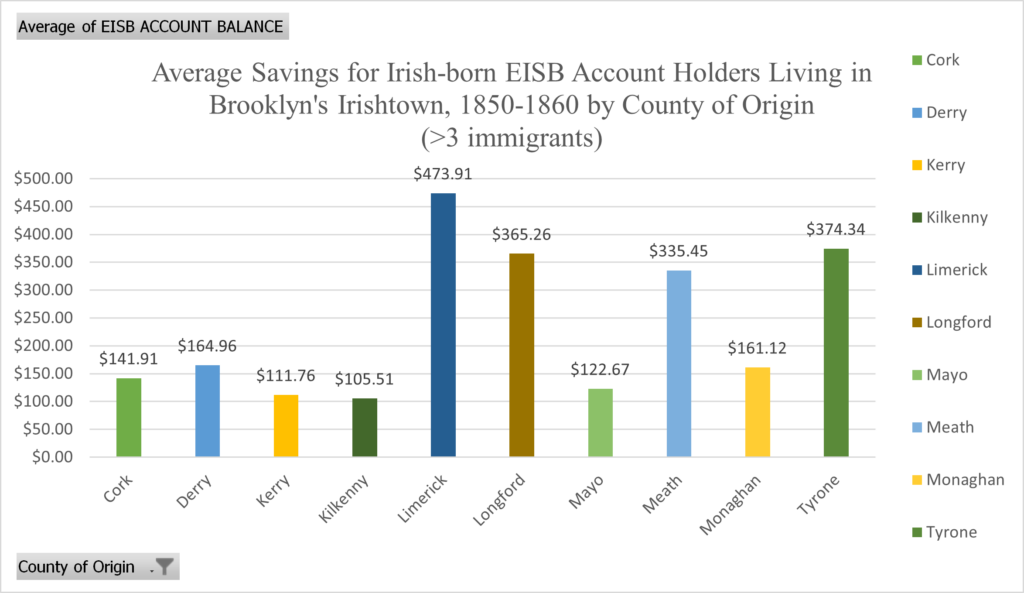
This chart shows the average savings balances for Irishtown residents broken down by their County of origin in Ireland, for counties that had more than three emigrants. Counties Limerick, Tyrone, and Longford have the highest average savings, with Counties Mayo, Kerry, and Kilkenny towards the lower end. Within our sample, all immigrants from County Mayo arrived after the famine, which could explain their lower average savings, and County Tyrone had most immigrants arriving before the famine, suggesting they may have had more time to build their savings. Aside from those two cases, we found no patterns in the data that could explain the spikes in savings. Chart by Mike Rivas Fernández
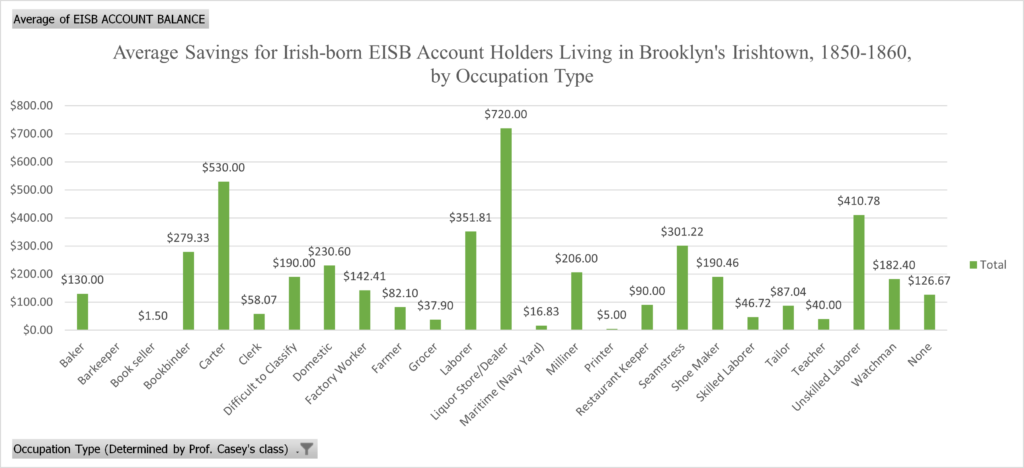
This chart shows the average savings balances for Irishtown residents broken down by the type of occupation. These occupation types more closely align to what was listed in the EISB records, and shows that Liquor Dealers had by far the highest average savings, followed by carters and laborers. The average savings for liquor dealers of $720 in 1860 dollars would be around $27,200 today (measuringworth.com). The highest individual savings balance in our sample, however, was Michael Foley, a railroad laborer who had a closing balance of $1,000, or around $36,400 in today’s dollars. Chart by Mike Rivas Fernández
Notes on Data Cleaning: We standardized some county names for consistency. For Counties Offaly, Laois, and Londonderry, we used the contemporary names of King’s, Queen’s, and Derry, respectively. When some immigrants listed Londonderry, we changed it to Derry, and apostrophes were added where needed for King’s and Queen’s. For immigrants whose address was listed as the corner of two streets (e.g., “Gold cor. Plymouth” or “Gold near Plymouth”), the Street Name is the first of the two listed. For when the year of arrival was not certain (e.g., some immigrants listed two years), the later year was utilized. The periods of emigration were broken down per the Irish Famine as follows: Pre-Famine (before 1845), Famine (between 1845 and 1851), and Post-Famine (after 1851). The occupations listed in the “Occupation Type” chart are as close to the original occupations listed on the EISB Test Books, standardized when the same occupation was listed in different ways (e.g., “Domestic,” “Housekeeper,” and “Keeping House” were all standardized as “Domestic”). From these categories we created the five Occupation Categories used in the other charts, as broader categories would allow for easier data analysis. Dollar amounts listed in the average savings come from the closing balances listed on the EISB account records, in 1860 dollars. Whenever listed, present-day dollar amounts come from measuringworth.com using the real wage/real wealth estimate and their most recent conversion, which at the time of writing is 2023 dollars. Dataset compiled and cleaned Fall 2024.